Your step-by-step guide to making the most of smart meters
Advanced metering infrastructure (AMI) is now in place across hundreds of thousands of homes in WA. If you’ve heard of smart meters but you’re not sure how you could benefit, here’s your step-by-step guide to making the most of this technology at home.
What is AMI?
AMI technology combines radio frequency communication points with intelligent metering software systems. The result is electricity metering technology which can provide more visibility with the opportunity to monitor and manage your electricity usage better than ever before.
If you have a smart meter, your electricity use is recorded for every 30 minutes of each day. This data is then usually available to you within two business days when you log in to My Account.
If you’ve wondered “Do I have a smart meter?” – it’s easy to tell. You will have received communications from us to let you know when your smart meter was being installed. If you sign up to My Account, you’ll also see an ‘Interval Data’ tab in the ‘Usage section.’
If you don’t yet have AMI, you can request to have a smart meter installed. It’s important to know that you’ll be charged a meter upgrade or replacement fee if you request a smart meter before your existing meter reaches the end of its life. There’s no direct charge when an existing meter is faulty and replaced with a smart meter or a smart meter is installed to replace a meter at the end of its life by Western Power.
What are the benefits of smart meters?
The main benefit smart meters can offer is that you could have more control over your electricity consumption. By seeing how you use electricity in intervals of 30 minutes, you have more visibility over when and how you’re using power.
You can then use your advance metering data to make habit changes. For example, if you noticed a spike in your electricity use when you ran your washing machine at 8pm, you could then try setting a load of washing to run during the day, using a timer. You might then see a difference in your electricity use in your advance metering data the next day, especially if you have solar panels that are generating renewable electricity at the same time. With this kind of visibility and management of your electricity use, you could avoid your next electricity bill coming as a surprise.
Having a smart meter means you can also access new time of use tariffs you are eligible for such as the Synergy Midday Saver Plan. This is a product where you pay different rates for your electricity depending on the time of day you use it.
What’s the difference between a smart meter and a regular meter?
One of the main differences between a smart meter and a regular meter is how your meter is read. Rather than needing to be manually read each billing cycle, a smart meter is remotely "read" using radio communications points. Meter data from a smart meter is automatically communicated to Western Power to calculate your overall electricity consumption, and then you receive your Synergy bill.
Having a smart meter installed also means that estimated bills might not be needed. As the name suggests, ‘estimated’ bills are based on the estimated electricity usage data where a meter cannot be read (for example if your meter can’t be accessed by a meter reader). Smart meters are likely to result in less estimated bills since they can be read remotely.
How to access your advanced metering data
To view your advanced metering data, you’ll first need to log in to My Account – or register for My Account if you haven’t already done so.
If you’ve recently had a smart meter installed, it’s worth taking the My Account tour when you first log in. You can explore the features of your smart meter and how to track your electricity usage, which could help you to reduce your electricity costs.
Once you have logged in to My Account, follow this step-by-step guide to finding and making the most of your usage data.
How to find your usage data
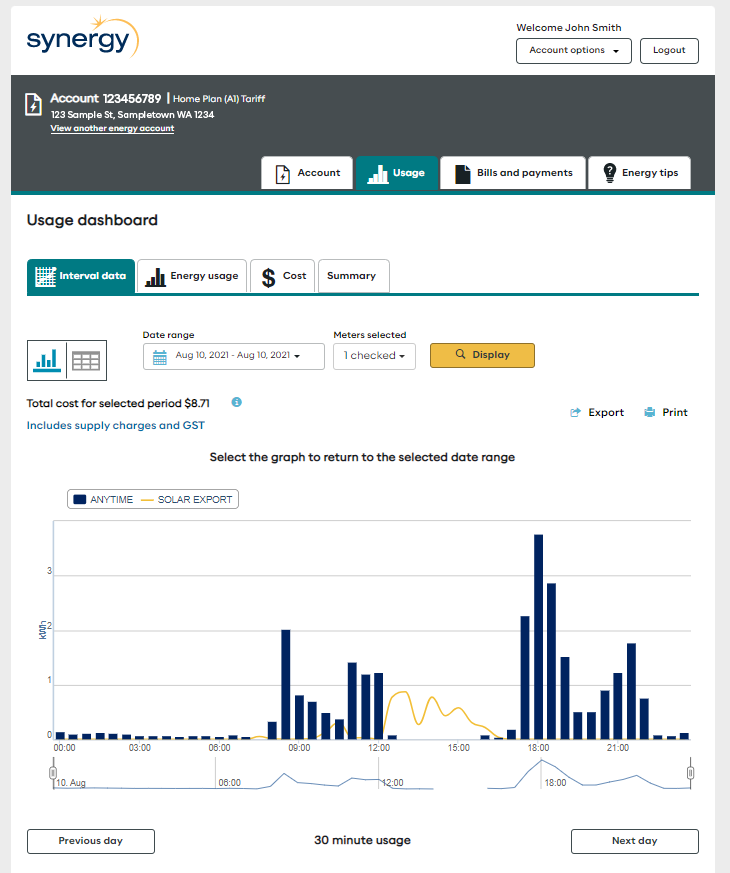
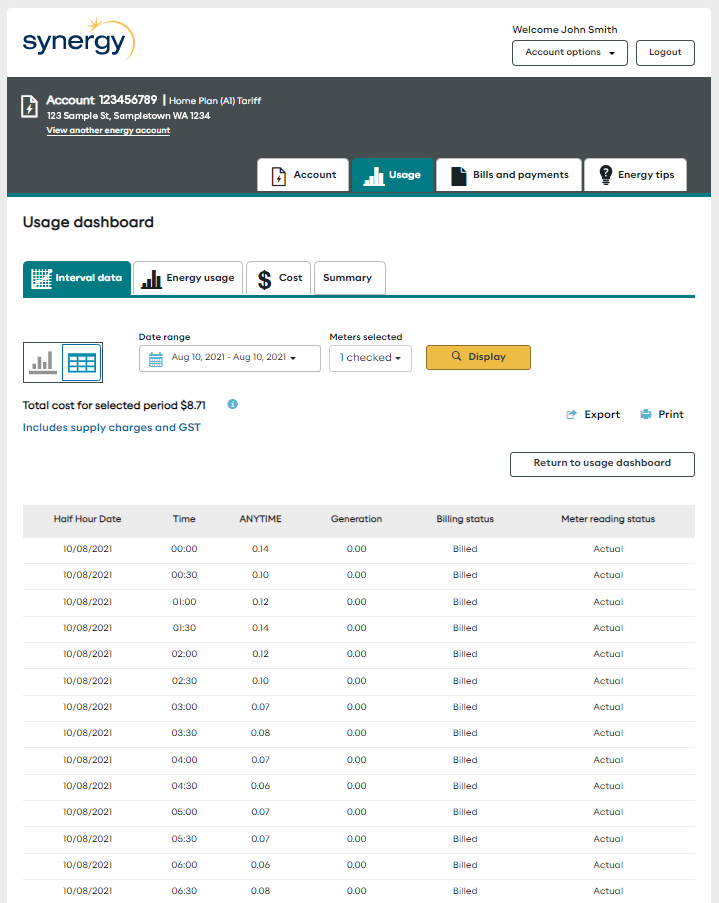
Navigate to the ‘Usage’ tab. Here you’ll see your usage dashboard.
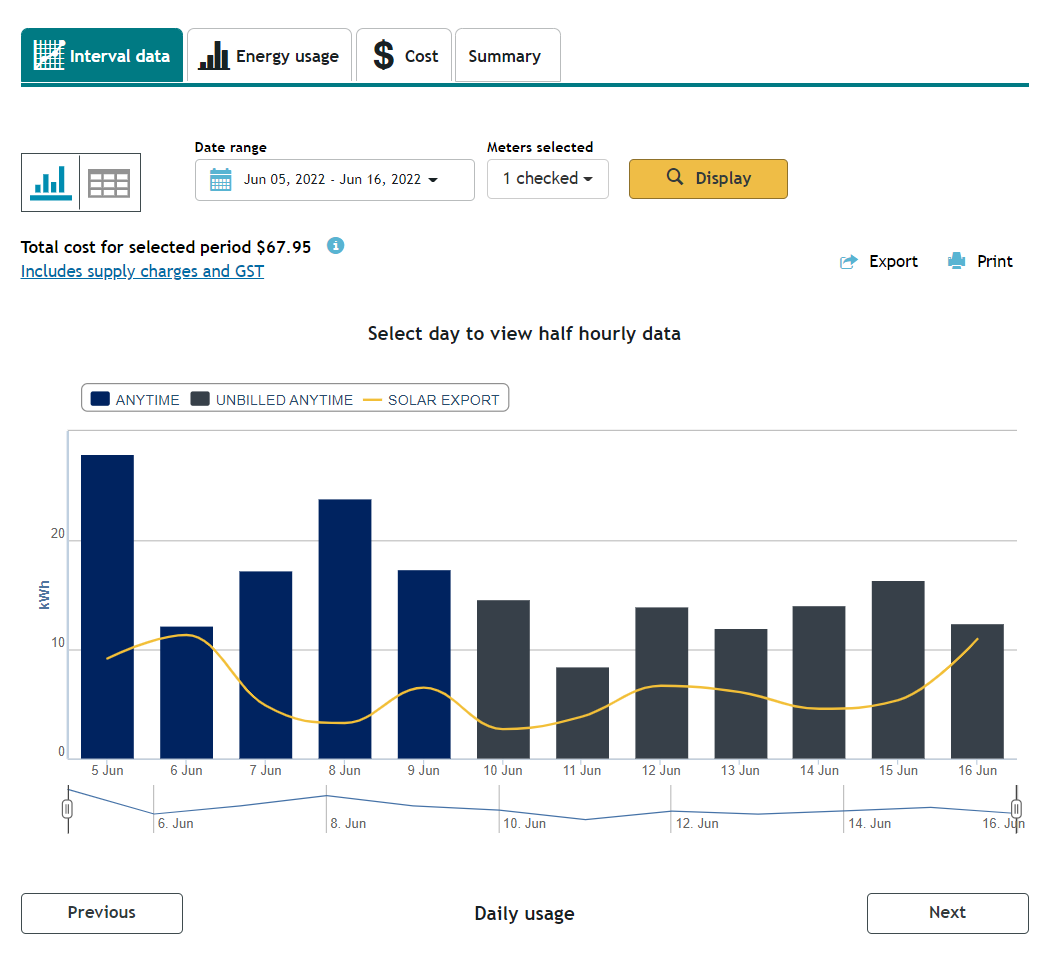
You can use the date range selector on the ‘Interval data’ tab to choose a particular date range to show your data. For example, you might like to see your usage for the past month.
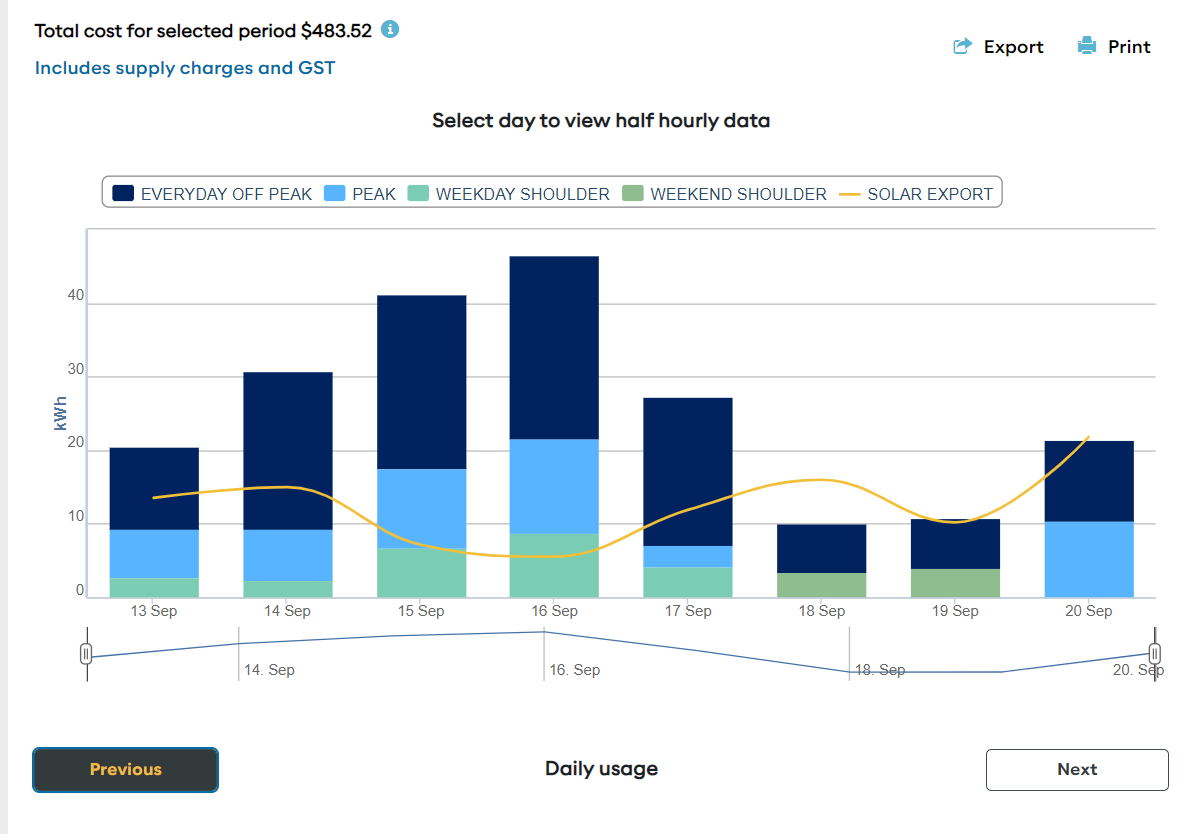
When you view your electricity usage data, you’ll also see the total cost (including the daily supply charges applicable) for the selected period.
On the graph you’ll find your billed electricity consumption as blue bars, unbilled electricity consumption as grey bars and, if you have solar, your solar energy export is represented as a yellow line.
For customers on a time of use tariff, usage data is represented as different colours, depending on the time period when the electricity was consumed.
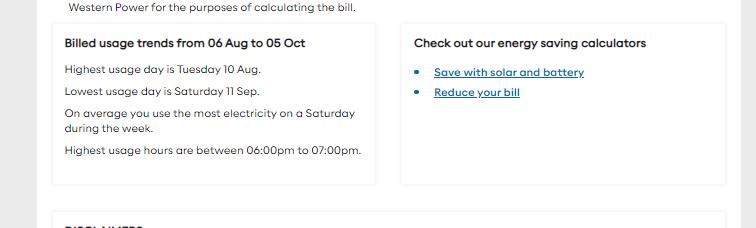
You can also see the days with your highest and lowest usage, as well as the day of the week you use the most and least electricity, on average, and when your highest usage hours are.
This data can help you better understand your electricity consumption patterns. For example, if most of your electricity is being used at night, you could consider shifting some of your consumption to the middle part of the day to make use of electricity being generated by your solar system, rather than drawing from the grid. This is known as load shifting.
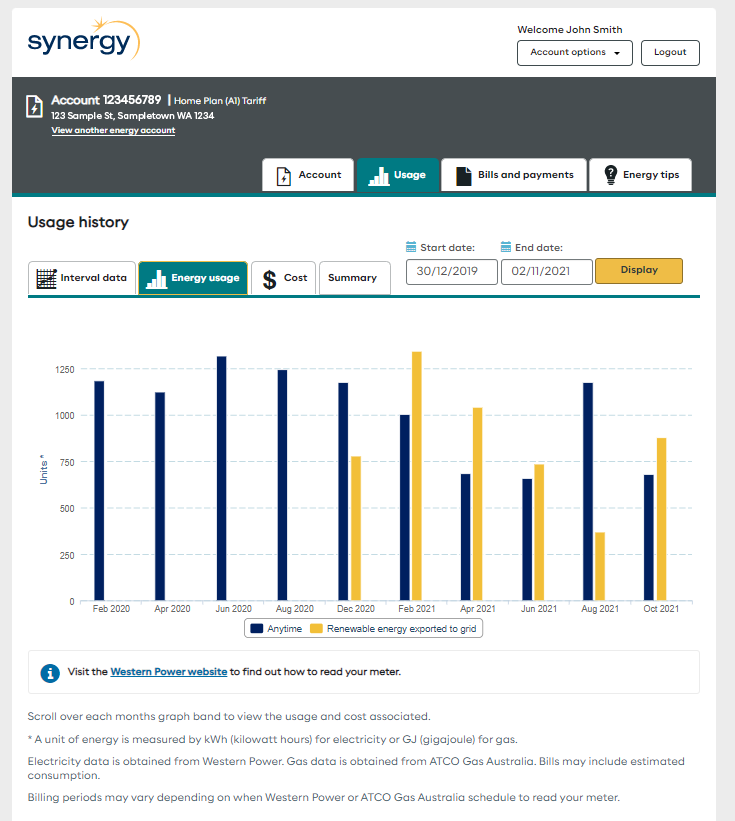
In the ‘Energy usage’ tab, you can also find your usage history as an overview by month. This could help you find patterns in your use so you can modify habits if you need to. For example, if you notice a spike in summer months compared with your use in spring, you could plan ahead for summer and find ways to reduce your usage.
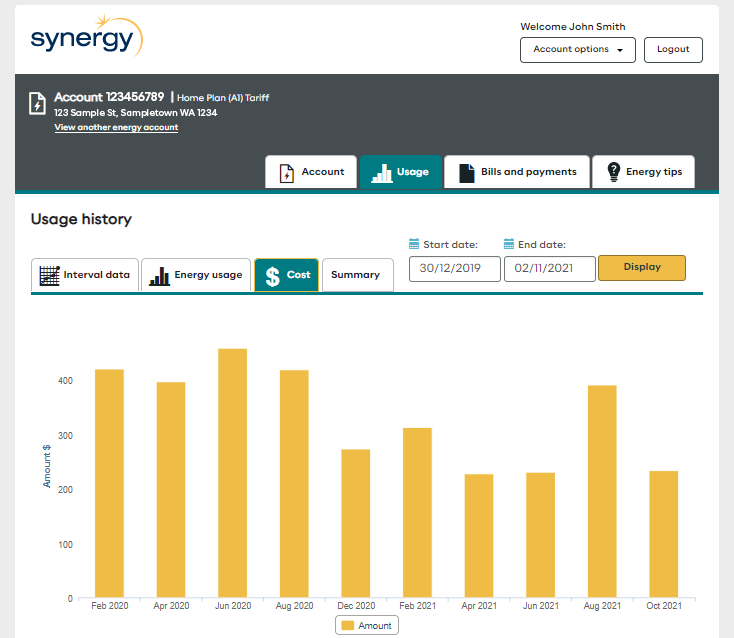
In the ‘Cost’ tab, you can see a cost overview chart. This could help you in planning your household budget.
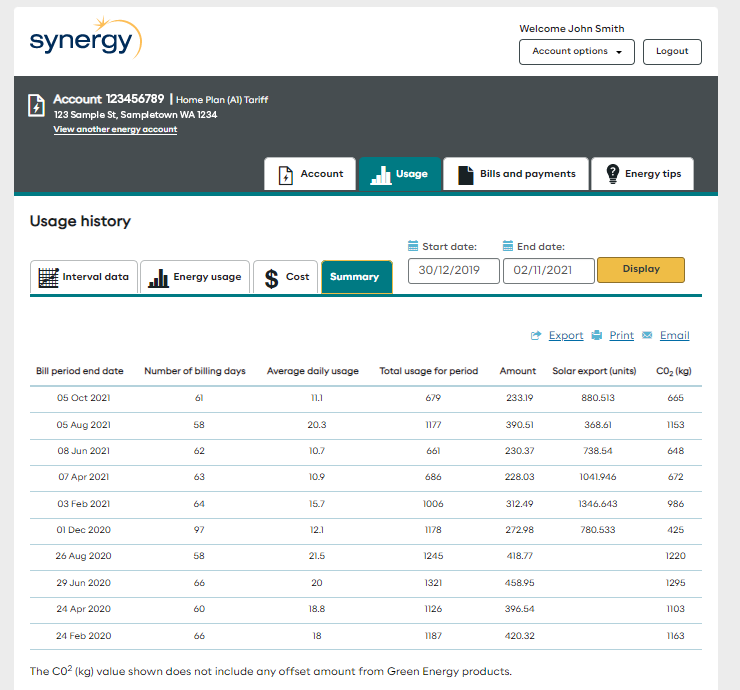
In the ‘Summary’ tab, you can find details on number of billing days, average daily usage, total usage for the period and other information which can be exported as a PDF or CSV file.
Make the most your smart meter
When you get in the habit of monitoring your electricity usage data, you can have more control over your consumption. You could then make informed decisions about the way you use electricity, change your habits to improve your energy efficiency and better budget for your electricity costs.
If you’re looking for more visibility over how you use electricity in your home, log in to MyAccount today.
Share: