Everything you need to know about the Duck Curve
In Western Australia, we’re rapidly embracing solar power and taking advantage of our sunny climate in a positive shift to embracing renewable energy. Over 36% of homes and businesses in the South West Interconnected System (SWIS) have installed rooftop solar PV systems. By harnessing the power of the sun, we can help create a more sustainable future for ourselves and our environment.
However, this high uptake of solar is not without challenges for our energy system, also known as the grid. This trend has reduced the demand for electricity from the energy system during the day, as homes and businesses use energy produced by their rooftop solar systems. This means there is increased strain on the energy system as it works to keep up with fluctuating supply and demand, which can create instability. Expressed graphically, the effect on the grid is known as the Duck Curve, and if it’s not addressed could potentially lead to blackouts in WA.
Together with the State Government and other industry participants, Synergy is helping explore different ways to support energy system reliability. We’ve run several exciting pilots and trials, from testing Virtual Power Plants (VPPs) to the Midday Saver Pilot which trialled a time-of-use tariff. These pilots and trials have helped us to develop intelligent energy solutions to help address the challenges that lie ahead.
Learn more about the Duck Curve, and how taking simple steps to adjust your energy use can help you make the most out of your solar investment and a positive difference to the system.
What exactly is the Duck Curve?
The Duck Curve refers to a graphical representation of electricity demand from the energy system on days when solar energy production is high and demand in the grid is low during the middle of the day, and when demand peaks in the evening. When plotted on a graph the lines and curves form a distinctly duck-like shape.
Essentially, the Duck Curve represents the potential for energy system instability, as the energy system attempts to cope with extreme changes in demand across different parts of the day.
As more solar energy is exported to the grid, usually across the middle part of the day when the sun is shining, the curves deepen. Then, as the sun sets and solar energy is no longer being generated, the Duck Curve typically shows extreme changes in demand and electricity generation from the energy system needs to ‘kick in’ suddenly – which can be difficult. These extreme changes in demand can result in the energy system becoming unreliable.
The term was coined around 2012 by the California Independent System Operator in the United States. The graphical representation was a way to demonstrate the demand for electricity from an energy system, with hourly solar generation and usage patterns. The Duck Curve is a worldwide phenomenon and now widely referenced in the energy industry.
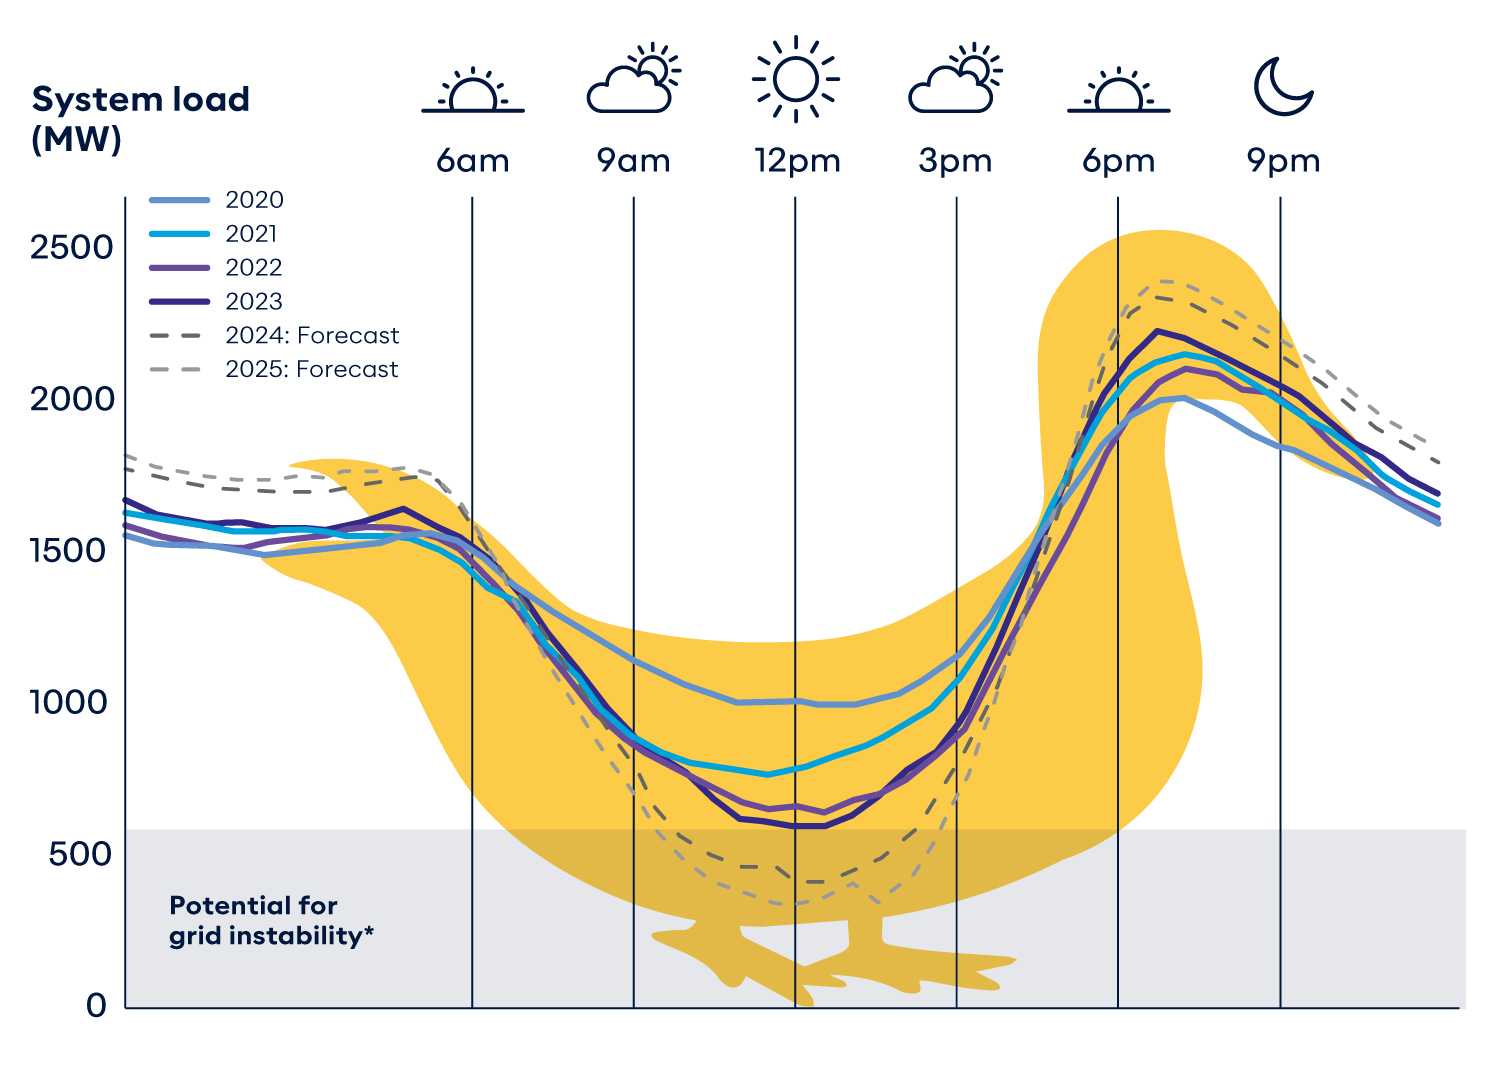
The graph above demonstrates a typical Duck Curve based on real data from the SWIS, it can be interpreted in this way:
- The lines give us our Duck Curve: they show the typical amount of electricity dispatched across the day.
- The large dip in the lines over the middle of the day – the sunniest time – is when solar energy is being generated. At this time larger generators may not be required to meet electricity demand.
- Then, as the sun sets and solar generation wanes, the lines take a steep upward curve to form a duck-like shape due to the sudden peak in demand.
It’s at this moment of sudden peak demand on the energy system that the system may become unreliable.
Synergy is focused on driving initiatives that could help manage this challenge. With WA transitioning to a renewable energy focussed future, the Duck Curve is a useful tool for better understanding and managing energy fluctuations.
What the Duck Curve means for WA
There are clearly benefits of having solar, so it’s not surprising that Western Australian homes and businesses are making the most of it. While the sun is shining, we can rely on solar energy to help keep things powered. But we must also consider how this impacts load and the energy system.
Load simply refers to the demand for electricity from the energy system. We use the term ‘low load’ to describe low demand for electricity from the energy system which typically occurs when solar energy output is high. This is represented by the lower line on the Duck Curve. It’s generally the time of day when people are out of the house at school and work, so electricity use is generally lower. At a time of ‘low load’, larger generators (gas or coal-fired) are not required to meet demand for electricity and may be turned down.
As the sun goes down and people return home to begin evening routines like cooking, laundry or watching TV, almost everybody requires electricity from the energy system and demand increases, resulting in ‘high load’, also known as peak demand. Because larger generators cannot be turned up quickly, when demand increases suddenly, the system may become unreliable. This is when there is a risk of a blackout occurring.
While solar is a fundamental part of WA's renewable energy future, we must recognise that solar generation is intermittent. If there is cloud cover, solar energy output can drop very quickly, creating potential instability in the system.
Despite many Western Australians embracing solar, people still need to access electricity from the energy system. Making small changes to the way we individually use energy can form part of the solution. If you have solar panels, consider shifting the time when you use appliances, such as your washing machine, to the middle of the day in order to consume more solar energy.
How Synergy is working to help overcome the challenges of the Duck Curve
As much of the world invests in renewable solar energy, WA is not alone in facing problems created by low load. However, the risks inherent in the energy system are potentially higher, given our exceptionally high uptake of rooftop panels and our climate delivering lots of sunshine and clear skies. The energy system was not designed to manage a two-way energy flow, with significant fluctuations in supply and demand.
These challenges are at the heart of future-focused initiatives to find solutions for a reliable energy future. In partnership with industry experts and the WA Government, Synergy is exploring options that include using household energy assets such as rooftop solar and batteries to support a reliable electricity system.
Synergy has run several pilot projects and trials, including the use of Virtual Power Plants (VPPs). One of the first VPPs trialled was with a number of WA schools. The coordination of the participating schools' energy assets enabled solar power to be generated, stored and dispatched based on demand. This helped us discover how we can create intelligent renewable energy solutions for the future that help provide energy system security and reliability. Learn more in our VPP video here.
Our approach is guided by the WA Government’s DER Roadmap that sets our State on a 5-year track to a safe, reliable and efficient energy system. The Roadmap addresses opportunities and challenges we all face in producing, storing, managing and using energy today and into the future.
Working towards a safe and secure energy system
With our abundant sunshine, solar generation has fast become a positive part of WA’s energy transformation. However, low load, as illustrated by the Duck Curve, presents challenges in managing energy system reliability to avoid the potential for blackouts.
Synergy is using the learnings of this shift to renewables, from other places in the world such as California and South Australia, along with insights from the pilots and trials we have conducted, to understand how we can help support the ongoing security and reliability of the energy system.
Find out more about WA’s intelligent energy future.
Share: